Is Jersey City Safe? A 2026 Guide by Neighborhood

Direct Summary
Jersey City is safer than it was a decade ago, and the trend is still improving. City data through August 15, 2026 shows violent and property crime both down double digits year-over-year. Safety varies significantly by neighborhood: waterfront areas like Downtown and Paulus Hook report far fewer incidents than parts of the city’s west and south side. Check any specific address before you assume a neighborhood’s reputation still applies.
Current city metrics show double-digit decreases in both violent and property crime across Jersey City, continuing a long-term safety improvement trend.
Every week, someone relocating for a job across the river, or a family looking to trade a Manhattan one-bedroom for more space, asks us some version of the same question: is Jersey City safe? It's a fair question for a city of over 300,000 people, and the honest answer has more nuance than a single crime score can capture.
This guide uses the city's own live crime dashboard, official year-end police data, and independent crime-research sources, not a five-year-old blog post, to answer it properly.
Is Jersey City Safe To Live In? What the Current Data Shows
Jersey City now publishes crime data in real time. In June 2026, the city launched JC IMPACT, a public dashboard the administration built specifically so residents wouldn't have to rely on year-old statistics or third-party crime-mapping sites to know what's happening in their neighborhood.
Here’s what it showed as of August 15, 2026, comparing year-to-date totals against the same period in 2025, ranked from the biggest year-over-year improvement to the smallest:
| Category | 2026 YTD | YoY Change |
|---|---|---|
| Robberies | 203 | Down 14% |
| Aggravated assaults | 562 | Down 16% |
| Burglaries | 279 | Down 28% |
| Thefts | 1,391 | Down 11% |
| Theft from auto | 316 | Down 47% |
| Stolen vehicles | 484 | Down 14% |
| Shots fired incidents | 23 | Down 36% |
| Illegal guns recovered | 121 | Down 22% |
| Homicides | 8 | Down 11% |
| Sexual assaults | 57 | Down 2% |
Source: JC IMPACT, City of Jersey City official crime dashboard, data through August 15, 2026, accessed August 20, 2026. The dashboard notes all figures are preliminary and subject to revision.
The improvement is broad-based rather than concentrated in one category. Property crime shows the steepest declines, led by theft from auto (down 47%) and burglaries (down 28%). Violent crime is also down across the board, from aggravated assaults (down 16%) to robberies and stolen-vehicle incidents (both down 14%) to homicides and overall thefts (both down 11%).
How Does 2026 Fit Into the Longer-Term Trend?
These declines continue a pattern that’s been underway for more than a decade. Homicides, the crime category with the most complete historical reporting, fell from 24 in 2014 to 10 in 2023, at the time the lowest annual total in the department’s recorded history, according to a December 2023 city announcement; then-Mayor Steven Fulop and Public Safety Director James Shea credited the drop to partnerships with the Hudson County Prosecutor’s Office and expanded surveillance camera coverage. The most recent independently compiled full-year figures, a 2024 report published in October 2025 by crime-research firm NeighborhoodScout (drawing on FBI Uniform Crime Reporting data), recorded 7 homicides that year, alongside 88 rapes, 515 robberies, and 1,063 assaults, for a violent crime rate of 5.52 per 1,000 residents. Property crime came in higher, at 19.96 per 1,000 residents, for 7,718 total crimes citywide in 2024.
Property crime is the category most residents are statistically likely to encounter directly. Motor vehicle theft alone accounted for 885 reported incidents in 2024, or roughly a 1 in 342 chance for any given car in the city, per NeighborhoodScout’s analysis. It’s also the category the 2026 IMPACT numbers above show improving the most, with theft from auto down 47% and stolen vehicles down 14% year-over-year.
One caveat applies to any Jersey City crime figure from before 2025, including the ones above. A city-commissioned internal review released in June 2026 found that at least 3,251 lower-level incidents from 2021 to 2024 hadn’t been properly logged in the FBI’s national reporting system, which the city attributed to inconsistent case-coding practices at the time. Homicide and other serious violent-crime totals were reported accurately throughout that period, so the decade-long trend above holds up; it’s the property-crime and lesser-offense totals from that window that are worth treating as a floor rather than an exact count. Former Mayor Steven Fulop, whose administration oversaw that period, has publicly disputed the audit’s framing, calling it politically motivated rather than a genuine data problem. The current administration treats 2025 forward as its more reliable baseline, and the corrected reporting process is what produced the 2026 IMPACT figures above.
How Does Jersey City Compare to Other Cities?
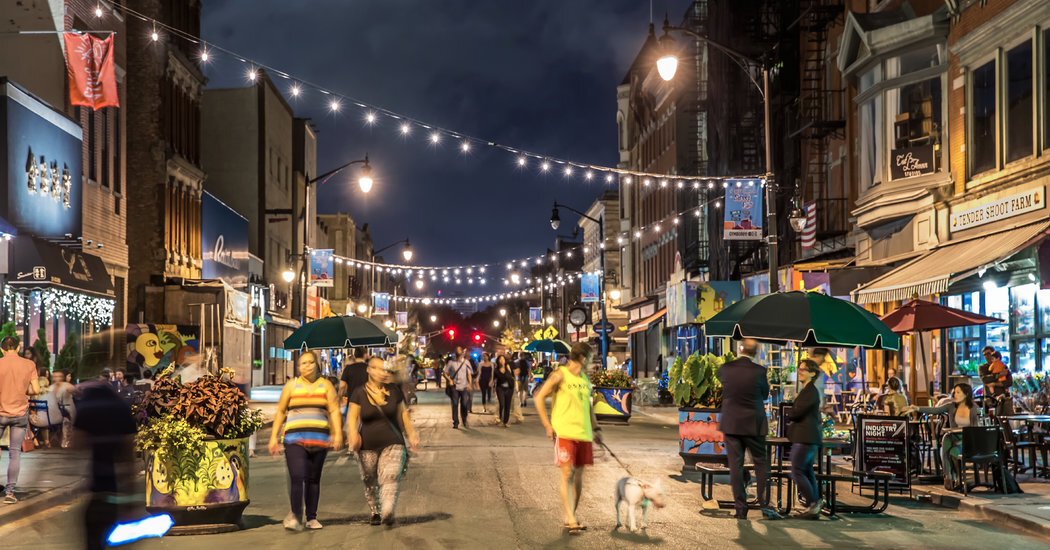
Like many vibrant, transit-rich urban centers, Jersey City's active pedestrian plazas and well-lit downtown streets reflect a thriving, highly walkable community.
This is where a citywide number needs some context to be useful.
Jersey City is the state's second-largest city, and dense, transit-heavy downtowns almost always report more incidents per capita than quiet suburbs, so comparing it to Millburn or Cranford isn't a meaningful exercise. Measured against those smaller towns, NeighborhoodScout's data does put Jersey City's overall crime rate higher than about 89% of New Jersey's other cities and towns, which says more about the difference between a city and a suburb than about how Jersey City itself is trending.
City officials made a more specific comparative claim in December 2023: then-Mayor Steven Fulop said Jersey City’s homicide rate had fallen below New York City’s for the first time in recent memory. That count held up under the city’s later data review (see above), but a single-year ranking between two very differently sized cities is a moving target, not a fact to treat as settled going forward. The more durable point is Jersey City’s own trajectory: homicides have been on a clear downward trend since 2014 (see above), and that’s the number worth watching rather than how the city compares to a much larger neighbor in any given year.
Jersey City is a genuine city, and it carries genuine city crime patterns, the kind you'd expect from any comparably dense American downtown. Measured against its own decade-long trend, it's heading in the right direction, and it still calls for the same everyday street-smarts you'd use in any dense urban area.
Which Jersey City Neighborhoods Are Safest?
79
Bergen-Lafayette (Ward F)
45
Greenville (Ward A)
The Heights, Journal Square, Downtown, and West Side all fell between those two. Scores update quarterly, check BlockIQ JC’s dashboard directly for current individual scores.
Source: BlockIQ JC, ward-level safety scores, Q1 2026 data refresh (JCPD NIBRS records), accessed August 20, 2026.
This is the question that matters most if you're choosing where to live, and it's also where a lot of older articles are furthest out of date. Jersey City's neighborhoods have changed fast, and a “worst neighborhoods” list built on 2022 or 2023 data can be actively misleading by 2026.
BlockIQ JC, a dashboard built directly on Jersey City Police Department NIBRS records and refreshed quarterly, scores the city's six wards on a 0-100 safety scale. As of its Q1 2026 update, Bergen-Lafayette (Ward F) ranked highest at 79, and Greenville (Ward A) ranked lowest at 45. The Heights, Journal Square, Downtown, and West Side all fell between those two, though BlockIQ's own dashboard is the best place to check their current individual scores, since wards get re-scored each quarter and a snapshot printed here will age.
Source: BlockIQ JC, ward-level safety scores, Q1 2026 data refresh (JCPD NIBRS records), accessed August 20, 2026.
Notice that Bergen-Lafayette, a neighborhood that older crime rankings (including consumer sites still citing 2022-2023 AreaVibes data) list among the city's least safe, now scores as the safest ward in this more current dataset. That's not a contradiction so much as a sign of how quickly the area has changed: Bergen-Lafayette has seen some of the heaviest new residential development and investment of any Jersey City neighborhood over the past three years, and crime patterns have shifted with it. It's a useful reminder not to trust a neighborhood's reputation over its current data.
Greenville reports the highest incident rate relative to population among the neighborhood-level sources we reviewed, including BlockIQ's current ward scores and older AreaVibes-based rankings. That's a neighborhood-wide average, not a verdict on every block: like the rest of Jersey City, Greenville includes established, quieter pockets alongside higher-incident ones, and a single citywide ranking misses that variation. If you're considering a home there, the move is to check the specific block's current data and factor it into your offer and due diligence, the same way you'd factor in a flood zone or a busy intersection, rather than ruling out the neighborhood on its average alone.
A word on methodology, since it affects what you should trust: some popular “worst neighborhoods” rankings blend crime data with unrelated factors like median income, unemployment, and home values into a single score. That can make a gentrifying, lower-income neighborhood look more dangerous than its actual reported crime justifies. When you're evaluating safety specifically, look for sources that isolate crime data on its own, like JC IMPACT citywide or BlockIQ at the ward level, rather than a blended “worst neighborhoods” score.

Neighborhoods across Jersey City evolve quickly; areas like Bergen-Lafayette have seen significant residential investment and shifting safety metrics in recent years.
Is Flood Risk Part of the “Is Jersey City Safe” Question?
For a lot of buyers, yes, and it's a factor most crime-focused articles skip entirely. Jersey City's Hudson-adjacent submarkets, including Exchange Place and Paulus Hook, sit close enough to the river that flood zone status affects both insurance requirements and, as of March 20, 2024, seller disclosure obligations under New Jersey's flood disclosure law.
If you're evaluating a specific property, check its FEMA flood zone designation before you get attached to it, not after you're under contract. We cover this in detail, including which pockets of Hoboken and waterfront Jersey City carry elevated risk and what flood insurance costs, in our Flood Zone & Flood Insurance Guide.
How Do You Find a Safe Home in Jersey City?
Start with the live data for the specific block you're considering, not the neighborhood's general reputation. JC IMPACT and BlockIQ JC are both free and updated regularly, and a five-minute check on either tells you more than a “top 10 worst neighborhoods” listicle. Then walk the block itself, more than once and at different times. A stretch near a transit hub can feel completely different at 8am, 6pm, and midnight, and that's not something a dashboard captures.
Ask about flood zone status alongside crime data too. In Hudson County, “is this area safe” has a water-risk component that most crime statistics leave out entirely. And where possible, work with someone who knows the blocks and not just the citywide averages. Crime patterns, flood risk, street lighting, and building security can all vary within a few blocks of each other here, and that level of detail rarely shows up in any dashboard.
Frequently Asked Questions
Thinking About Moving to Jersey City?
Crime data and flood maps only tell you so much. The rest comes from knowing the blocks, the buildings, and how a neighborhood feels day to day. The Jill Biggs Group works with buyers and renters across Jersey City, Hoboken, and Hudson County every day.